WHEN CLUSTERING MEETS CYBER-SECURITY:
MACHINE LEARNING AND ALGORITHMS:
UNSUPERVISED METHOD:

Greetings, lovely people. I hope you’re doing well, improving, and getting the most out of your job and studies. We’re back with one of the most under appreciated topics in the field of data science, which is also the most vital and enjoyable to study and use, and which serves as the foundation for many algorithms and machine learning models .i.e Introduction in Clustering, we’ll see a bunch of things like how it works, how to implement, why we use Clustering, Algorithms used in Clustering how to recognise data patterns through different algorithms and much more.
So let’s get started.
Starting from the very start let us see the
DEFINITION OF MACHINE LEARNING.
→ Machine Learning (ML) is the study of computer algorithms that learn and improve automatically from experience (i.e historical data) without being explicitly programmed.
Try to analyse the above image for 2 minutes; can you spot any patterns or images?
Congratulations if this is the case. If not, relax; you’re not missing anything; simply reduce the size of the preceding image and analyse it again.
FOCUSING ON UNSUPERVISED MACHINE LEARNING:
- The task of inferring a function to describe hidden structure from unlabelled
data = UNSUPERVISED LEARNING
- Distribution / Probability Density Function
- Summary statistics
2. Algorithms used to draw inferences from datasets consisting of input data without labelled responses.
BIGGEST DIFFERENCE BETWEEN SUPERVISED AND UNSUPERVISED LEARNING:
- The primary distinction between supervised and unsupervised learning is the requirement for labelled training data. Unsupervised learning uses unlabelled or raw data, whereas supervised learning uses labelled input and output training data.
- Since the examples given to the learner are unlabelled, there is no error to evaluate a potential solution — this distinguishes unsupervised learning from supervised learning.
JUST ATTEMPT TO UNDERSTAND THE PATTERNS IN DATA
Question we need to ask while understanding the patterns in data:
- Which value(s) occur most frequently?
- How much does the data vary?
- How symmetrically does data vary around the centre?
- Is data clustered around value(s)?
- Subspace where data is “concentrated”
Let’s analyse the below data and understand some basic concepts of clustering and what we need to keep in mind while performing the clustering:
CLUSTERING:
Another sort of connection that is important in many Data Science applications is the similarity between rows of a dataset. This is known as clustering.
FOR EXAMPLE:
- Relationship among columns: We may need to understand if AGE and INCOME are related or if INCOME and FAMILY SIZE are associated with Credit card average balance.
- Relationship among rows: Additionally, we need to know whether person 3 is similar to person 6 and person 4 is similar to person 5 or 9 and so on. Can we cluster people based on how similar they are?
QUICK QUESTION PART-1:
WHEN CAN WE CLUSTER THE DATA ? OF COURSE WE CANNOT RANDOMLY CLUSTER ANY DATA.
So,
1. Data instances similar to (near) each other are in the same cluster.
2. Data instances different (far away) from each other are in the different clusters.
QUALITY/ TYPES OF CLUSTERS:
1. INTRA-CLUSTER COHESION (COMPACTNESS):
Cohesion measures how near the data points in a cluster are to be cluster centroid.
2. INTER-CLUSTER SEPARATION: (ISOLATION):
Separation means that different centroids should be far away from one another.
NOTE: Concept of Distance is central to all of the above.
QUICK QUESTION PART-2:
We just learned about Distance and separation and isolation but, how to exactly calculate the DISTANCE?
No worries: here is where numerical approaches of mathematics come into play.
METHOD-1: EUCLIDEAN DISTANCE OR L² NORM:
NOTATIONS:
p,q = Two points in Euclidean n-space.
pi, qi = Euclidean vectors, starting from the origin of the space (initial point)
n = n-space
METHOD-2: MANHATTAN DISTANCE OR L1 NORM:
Manhattan distance is also known as City Block distance which is calculated by formula
|x2-x1|+|y2-y1|
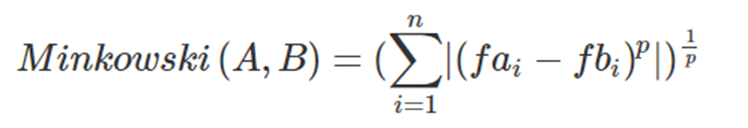
METHOD-3: MINKOWSKI DISTANCE OR LQ NORM:
FORMULA:
NOTE:
Both unsupervised and supervised learning and their respective algorithms are tools, We just need to understand when to use what !
Without wasting much time, Let’s move to another and more interesting part of the blog i.e understanding Association rule mining and everything else about it.
CLUSTERING HAS SEVERAL INTRIGUING ALGORITHMS TO ATTEMPT:
1. K-MEANS:
K-MEANS is a partitional clustering algorithm as it partitions the given data into K-clusters.
1. Each cluster has a cluster centre, called CENTROID.
2. K is specified by the user.
2. AGGLOMERATIVE HIERARCHICAL CLUSTERING:
This is a hierarchical clustering algorithm as it creates a hierarchy of clusters and sub clusters.
1. Starts with each point as a singleton cluster.
2. Repeatedly merges the two closest clusters till a single, all-encompassing cluster emerges.
3. DBSCAN:
This is a density based partitional clustering algorithm.
1. Number of clusters is automatically determined by the algorithm.
2. Points in low-density regions are classified as noise and omitted.
LET’S DIVE DEEP INTO THOSE ALGORITHM TO SEE HOW IT ACTUALLY WORKS ?
K-MEANS CLUSTERING:
Try to analyse the graph once.
Let’s take a short look at what’s going on in the graph above and how K-means clustering works.
- Let us say K =2
- So, here the two centroids (red star and blue star represented as centroids) are randomly initialised.
- Points closer to the centroid are allocated to that cluster.
- In short the points in each cluster (centroids) are recomputed.
WHAT’S HAPPENING HERE ?
In the above graph, the points are reassigned to the clusters whose centroids (stars) they are closer to, and the process repeats till the algorithm converges.
THE FINAL GRAPH
The final step includes no further changing the position of centroids as CLUSTERING ALGORITHM has converged.
SHORT SUMMARY OF WHAT WE HAVE SEEN TILL NOW IN K-MEANS CLUSTERING:
→ Given K, the K-Means algorithm works as follows:
- Randomly choose K data points (also termed as seeds by many we have taken k = 2) to be the initial centroids (i.e cluster centres).
- Assign each data point to the closest centroid
- Re-compute the centroids using the current cluster memberships.
- If the convergence criterion is not met, or if some clusters don’t get any points, go to Step-2 again and repeat.
WHAT EXACTLY A STOPPING OR CONVERGENCE CRITERIA:
- NO (or minimum) re-assignments of data points to different clusters
- NO (or minimum) change of centroids.
- OR Minimum decrease in the cost function, SUM OF SQUARED ERROR (SSE),
NOTATIONS:
Where Ck is the k^th cluster, ck is the centroid of cluster Ck (the mean vector of all the data points in Ck) and distance is the Standard Euclidean distance between two objects.
LIMITATIONS OF K-MEANS TO KEEP IN MIND:
- Outliers can cause issues as SSE increases, or small clusters may bond with outliers to provide the unnatural clusters.
- Categorical or Mixed data cannot be handled properly.
- Initially when centroids are at random, results may vary according to the clusters.
- Non-convex clusters aren’t handled well.
SOLUTIONS TO THE LIMITATIONS OF K-MEANS :
MOVING FORWARD…
2] AGGLOMERATIVE HIERARCHICAL CLUSTERING (AHC):
WORKING OF AHC ALGORITHM:
- Start with all the points as individual clusters, i.e Assigning each item to its own cluster, so that if you have N items, you now have N clusters, each containing just one item.
- At each step, merge the two closest clusters until only one cluster remains
- Compute the distances (similarities) between the new cluster and each of the old clusters.
- Repeat the steps 2 and 3 until all items are clustered into a single cluster of size N.
KEY OPERATIONS TO KEEP IN MIND:
- This requires the definition of cluster proximity, i.e., the distance matrix or the proximity matrix. Therefore, this is also a distance-based algorithm like K-Means.
- Various agglomerative hierarchical techniques are differentiated in the way they define the proximity.
HOW IS IT DIFFERENT FROM THE K-MEANS ALGORITHM ?
- K is not specified as an APRIORI. However, a termination condition is needed.
- Computationally expensive as distance between each pair of points is calculated for the proximity matrix.
EXAMPLE:
LET’S UNDERSTAND THE PROXIMITY DISTANCE BETWEEN THE CLUSTERS :
LASST BUTTT NOTT THE LEAST:
3] DBSCAN: [DENSITY BASED SPATIAL CLUSTERING OF APPLICATIONS WITH NOISE]:
DBSCAN deals with the three types of data points, i.e.,
1. CORE POINT:
A point is core if it has more than MinPts within eps.
[1. EPS = Generally when we talk about density the question that normally bugs us is how do we estimate the density so here, the density is estimated by counting the number of points within a specified radius, eps, of a particular point in the dataset.
2. MinPts = Here MinPts is a short form of Minimum number of datapoints with eps radius. Minimum value must be equal to 3.
RULE OF THUMB: If there are ‘p’ variables, then MinPts >= p+1]
2. BORDER POINT:
A point that is lower than MinPts within eps but is in the neighbourhood of a core point.
3. NOISE POINT OR OUTLIER:
A point that is neither core nor border.
WORKING OF AN ALGORITHM:
1. Pick a data point that has not been visited even once, randomly from X.
2. If number of points within eps > MinPts, create a cluster; otherwise label it as noise
a. For each point in this new cluster, repeat (ii)
3. Repeat till all points are exhausted.
CLUSTERING MEETS CYBER-SECURITY:
Clustering in cyber security can be utilised for a variety of objectives, including:
Cluster analysis simply means grouping data points that are similar to each other and are found throughout the network in order to reveal hidden and unusual patterns of activity and detect cyber security attacks that would otherwise be undetectable by analysing the entire problem from a single point of data.
I’ve attempted to demonstrate how we may utilise cluster analysis to locate patterns in malware datasets, as clustering is an unsupervised machine learning approach capable of detecting odd malware assault patterns and identifying malicious software behaviour.
In this case, I implemented the K-means Clustering detection technique to detect malware behaviour in data based on malware attributes. Locate the Jupyter notebook for the preceding case study, and please let us know what you discover at the end :)
GITHUB GIST :❤️
TOOK PROBLEM STATEMENT FROM KAGGLE: REFER IT HERE👇🏻
https://www.kaggle.com/datasets/piyushrumao/malware-executable-detection
FOLLOW US FOR THE SAME FUN TO LEARN DATA SCIENCE BLOGS AND ARTICLES:
LINKEDIN: https://www.linkedin.com/company/dsmcs/
INSTAGRAM: https://www.instagram.com/datasciencemeetscybersecurity/?hl=en
GITHUB: https://github.com/Vidhi1290
TWITTER: https://twitter.com/VidhiWaghela
MEDIUM: https://medium.com/@datasciencemeetscybersecurity-
- TEAM DATA SCIENCE MEETS CYBER SECURITY ❤️💙
